Signed-off-by: Martin Buchleitner <mbuchleitner@infralovers.com> |
||
|---|---|---|
| .travis | ||
| cmd/unifi-poller | ||
| examples | ||
| init | ||
| pkg/unifi-poller | ||
| scripts | ||
| templates | ||
| .dockerignore | ||
| .gitignore | ||
| .travis.yml | ||
| Dockerfile | ||
| Gopkg.lock | ||
| Gopkg.toml | ||
| LICENSE | ||
| Makefile | ||
| README.md | ||
README.md
Unifi Poller
Collect your Unifi Controller Data and send it to an InfluxDB instance. Grafana dashboards included. Updated 2019.
Installation
Backstory
Okay, so here's the deal. I found a simple piece of code on github that sorta did what I needed; we all know that story. I wanted more data, so I added more data collection. I believe I've completely rewritten every piece of original code, except the copyright/license file and that's fine by me. I probably wouldn't have made it this far if Garrett hadn't written the original code I started with. Many props my man.
The original code pulled only the client data. This app now pulls data for clients, access points, security gateways and switches. I currently own two UAP-AC-PROs, one USG-3 and one US-24-250W. If your devices differ this app may miss some data. I'm willing to help and make it better. Open an Issue and we'll figure out how to get things working for you.
What's this data good for?
I've been trying to get my UAP data into Grafana. Sure, google search that. You'll find this. And that's all you'll find. What if you don't want to deal with SNMP? Well, here you go. I've replicated 90% of what you see on those SNMP-powered dashboards with this Go app running on the same mac as my Unifi controller. All without enabling SNMP nor trying to understand those OIDs. Mad props to waterside for making this dashboard; it gave me a fantastic start to making my own.
I've also created another forum post you may use to get additional help.
What now...
- Are there other devices that need to be included?
I have: switch, router, access point. Three total, and the type structs are likely missing data for variants of these devices. e.g. Some UAPs have more radios, I probably didn't properly account for that. Some gateways have more ports, some switches have 10Gb, etc. These are things I do not have data on to write code for. If you have these devices, and want them graphed, open an Issue and lets discuss.
- Better Installation instructions.
If you're a nerd you can probably figure it out. I'd still like some pretty pictures and maybe even a Twitch VOD. Update: The installation has been simplified tremendously with the creation of binary packages. More to come!
- Radios, Frequencies, Interfaces, vAPs
My access points only seem to have two radios, one interface and vAP per radio. I'm not sure if the graphs, as-is, provide enough insight into APs with other configurations. Help me figure that out?
What's it look like?
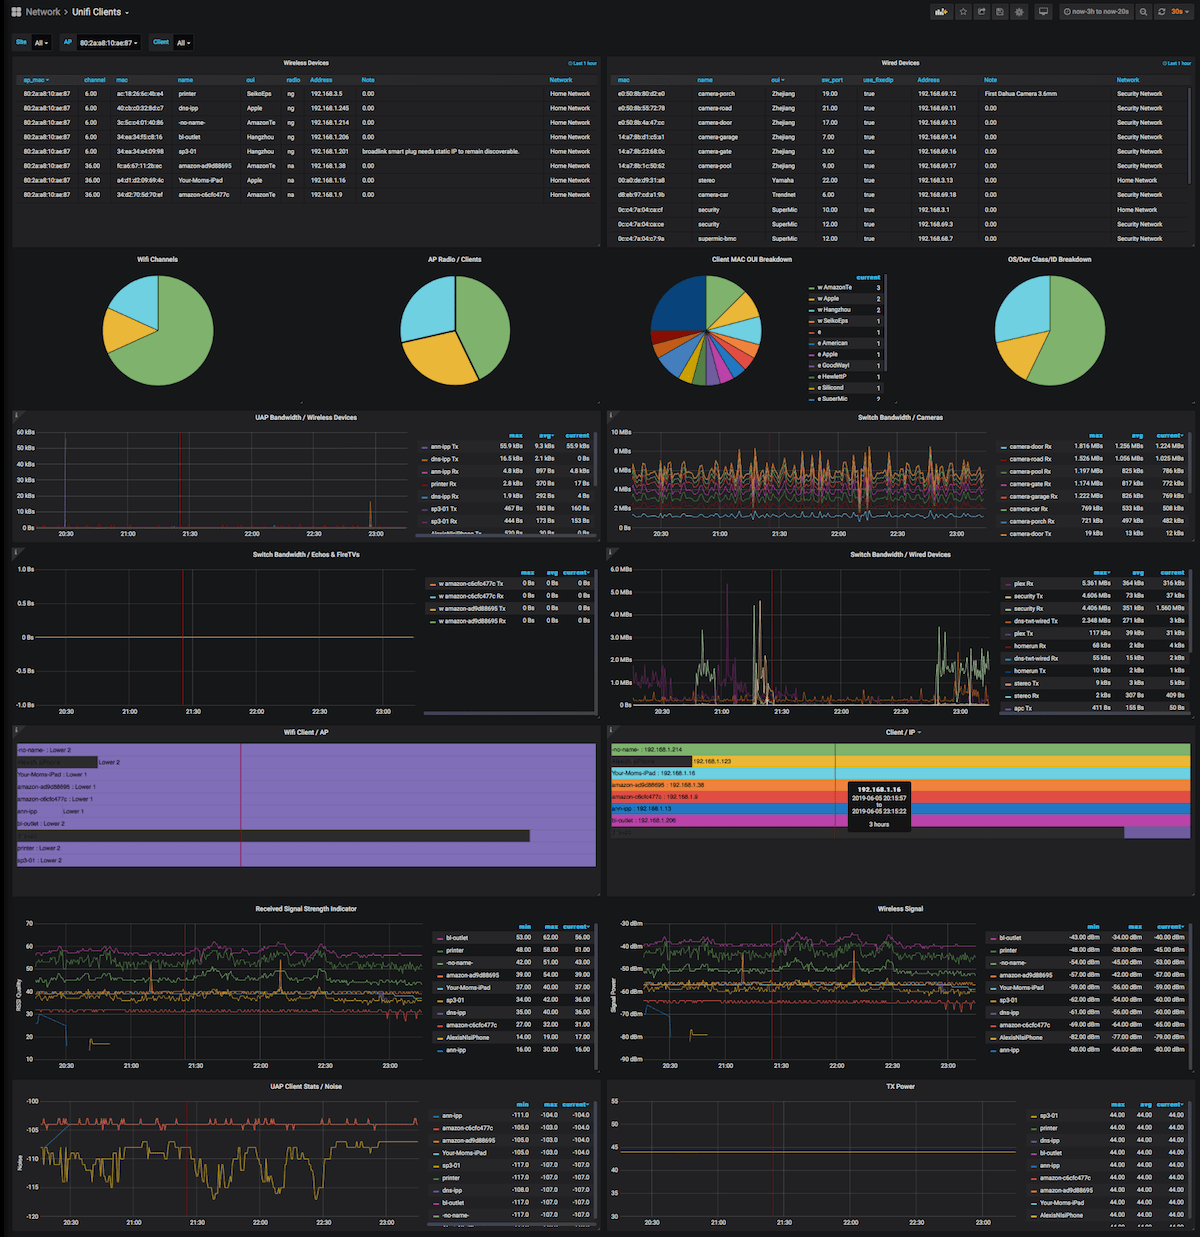
Here's a picture of the Client dashboard.
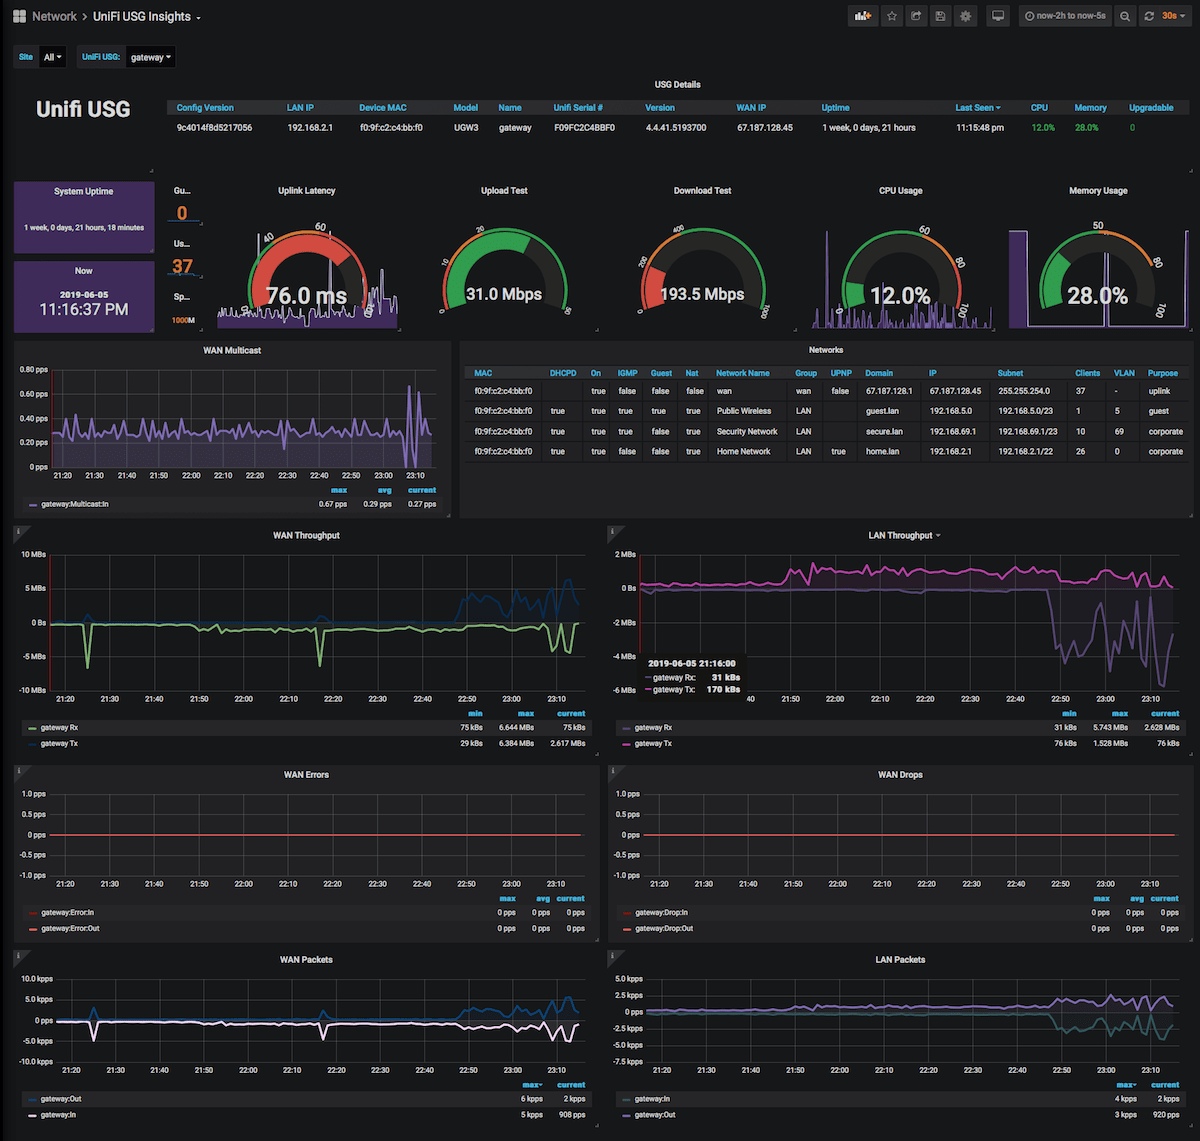
Here's a picture of the USG dashboard.
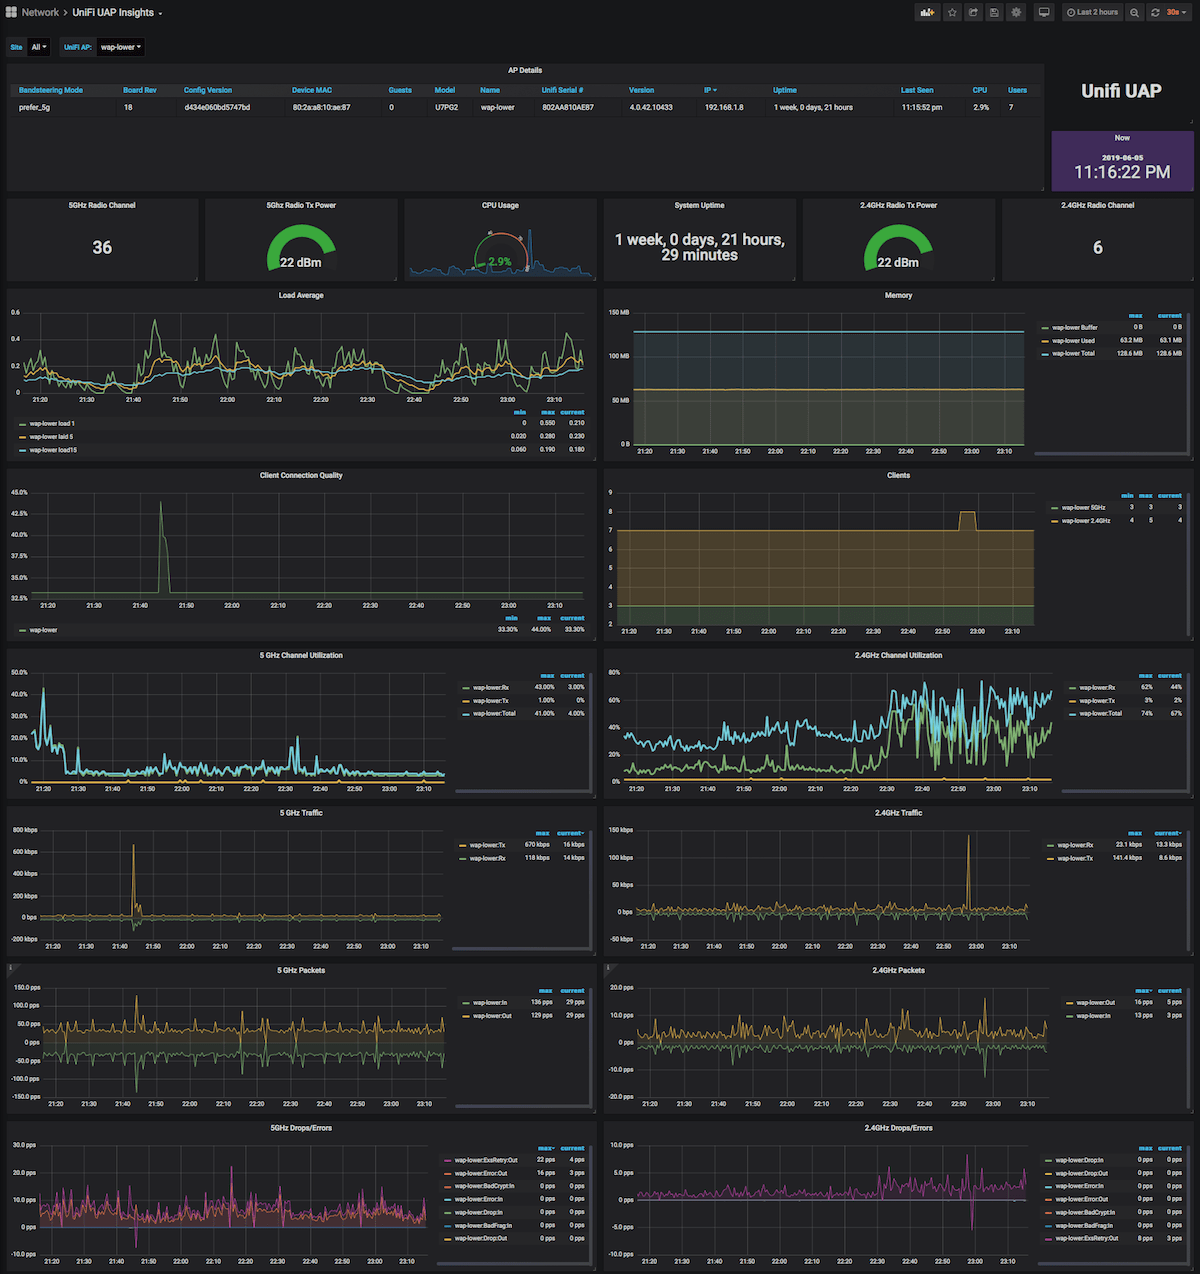
Here's a picture of the UAP dashboard. This only shows one device, but you can select multiple to put specific stats side-by-side.
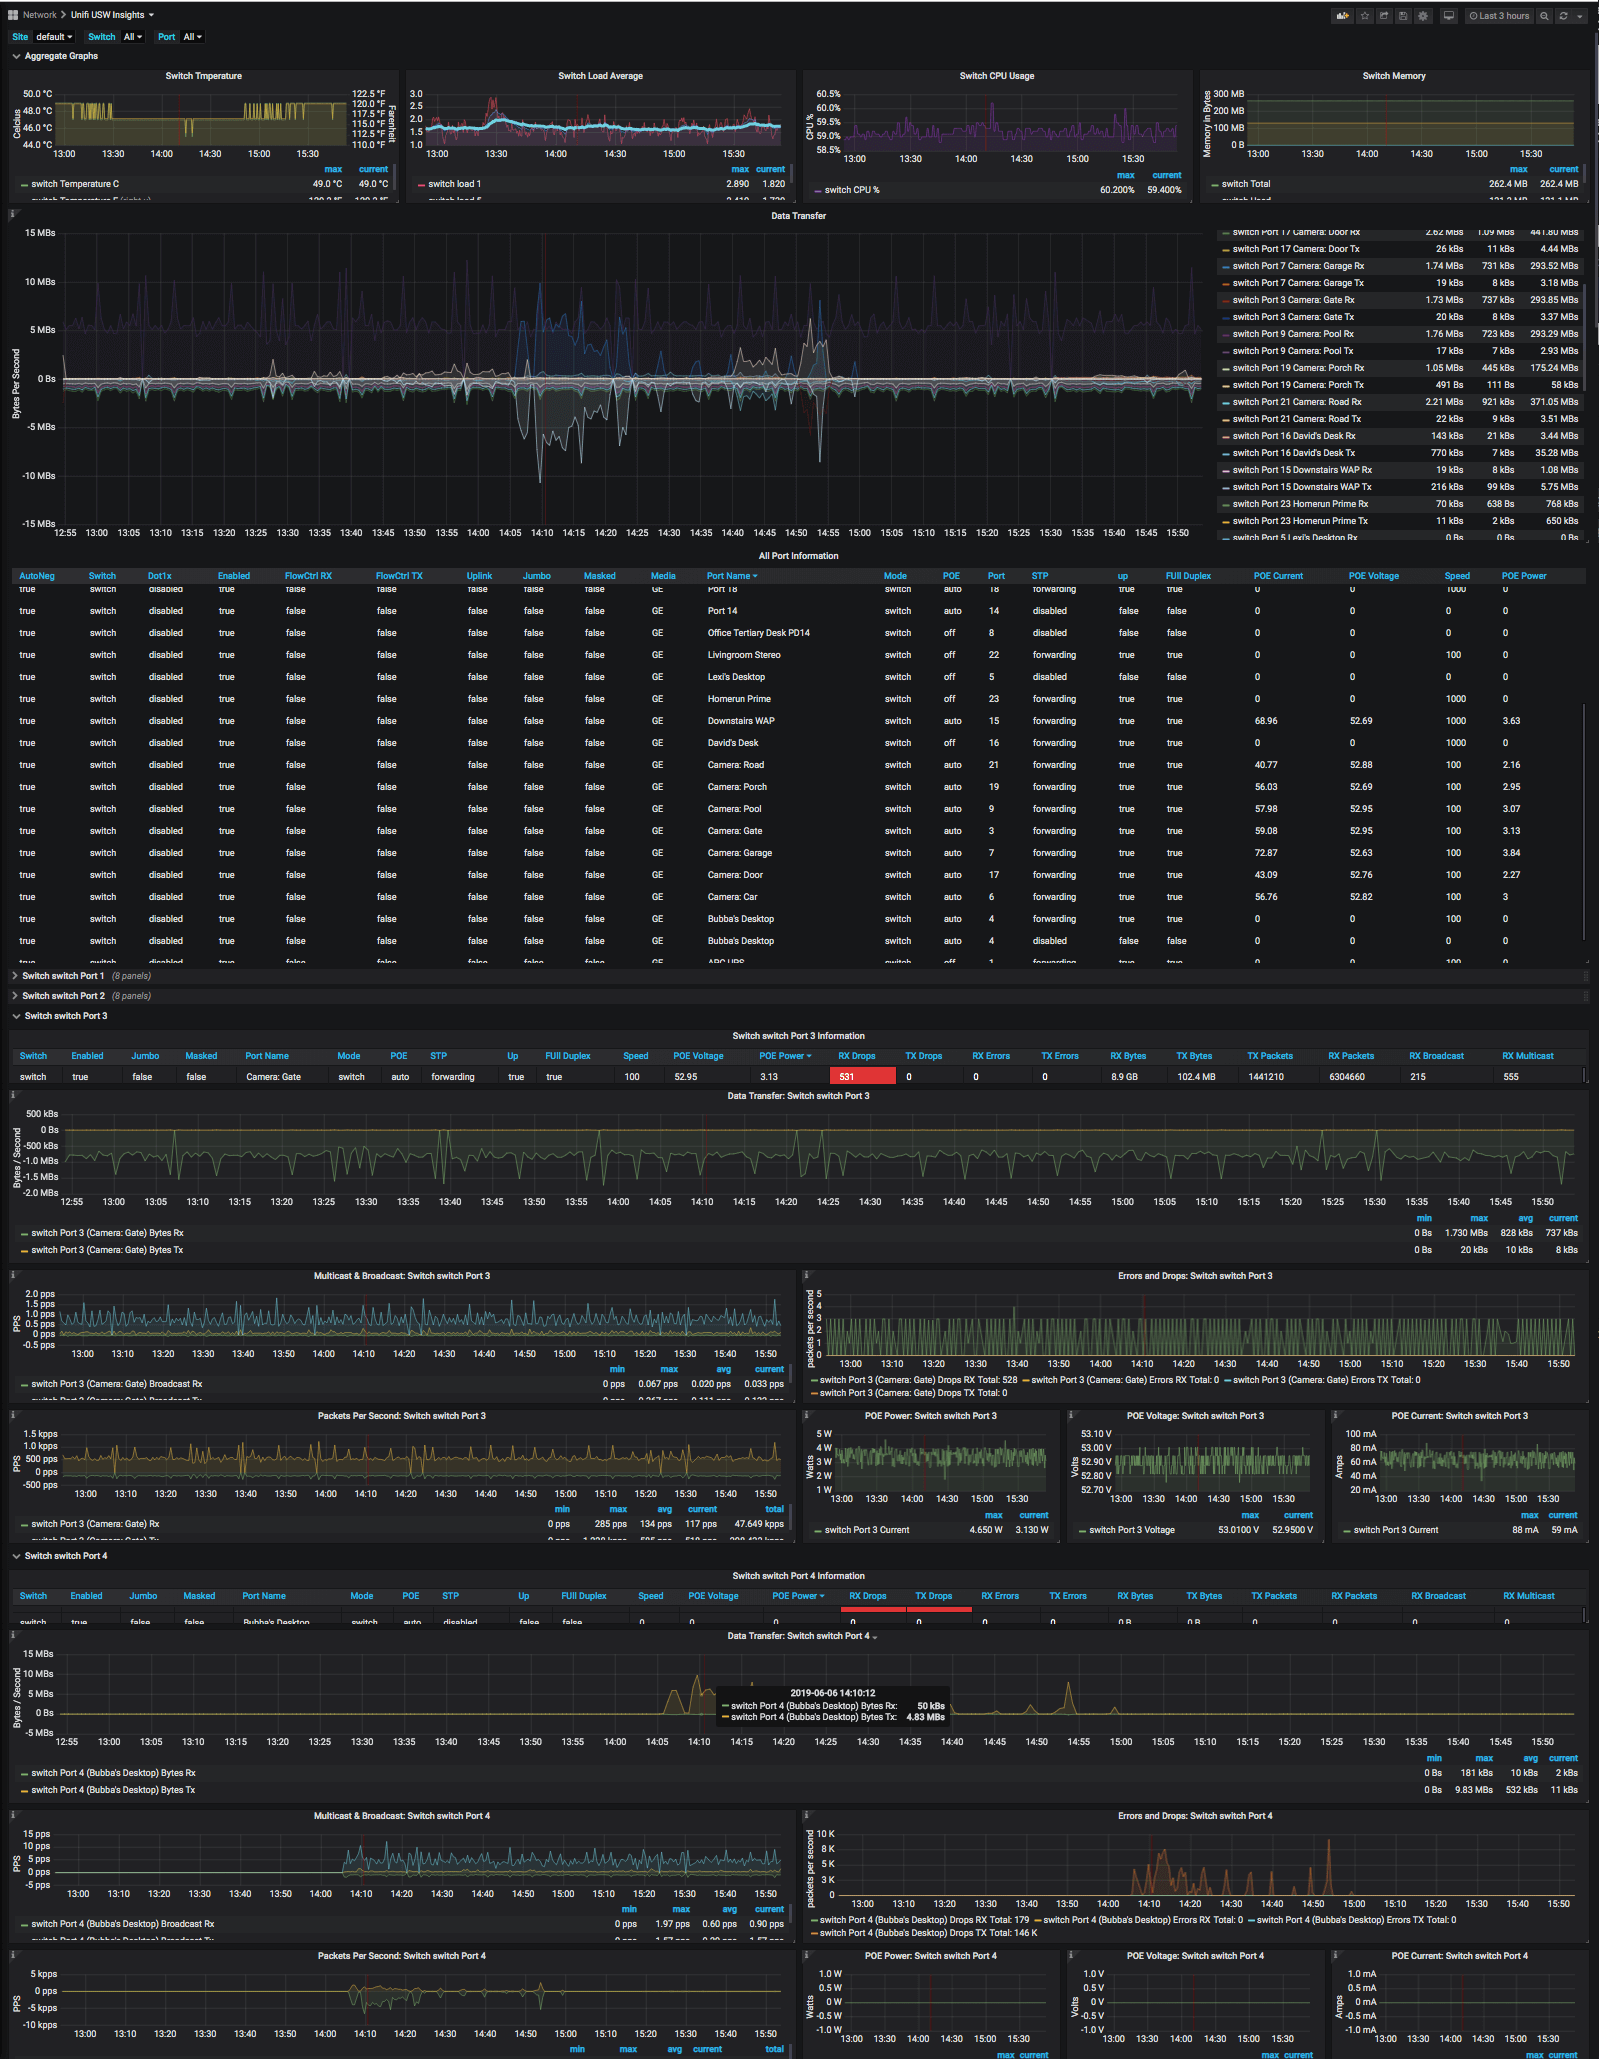
The USW / Switch Dashboard is pretty big with one data-filled section per selected port. You can drill down into specific sites, switches, and ports. Compare ports in different sites side-by-side. So easy! This screenshot barely does it justice.
Copyright & License
- Copyright © 2016 Garrett Bjerkhoel.
- Copyright © 2018 David Newhall II.
- See MIT-LICENSE for license information.